Coding
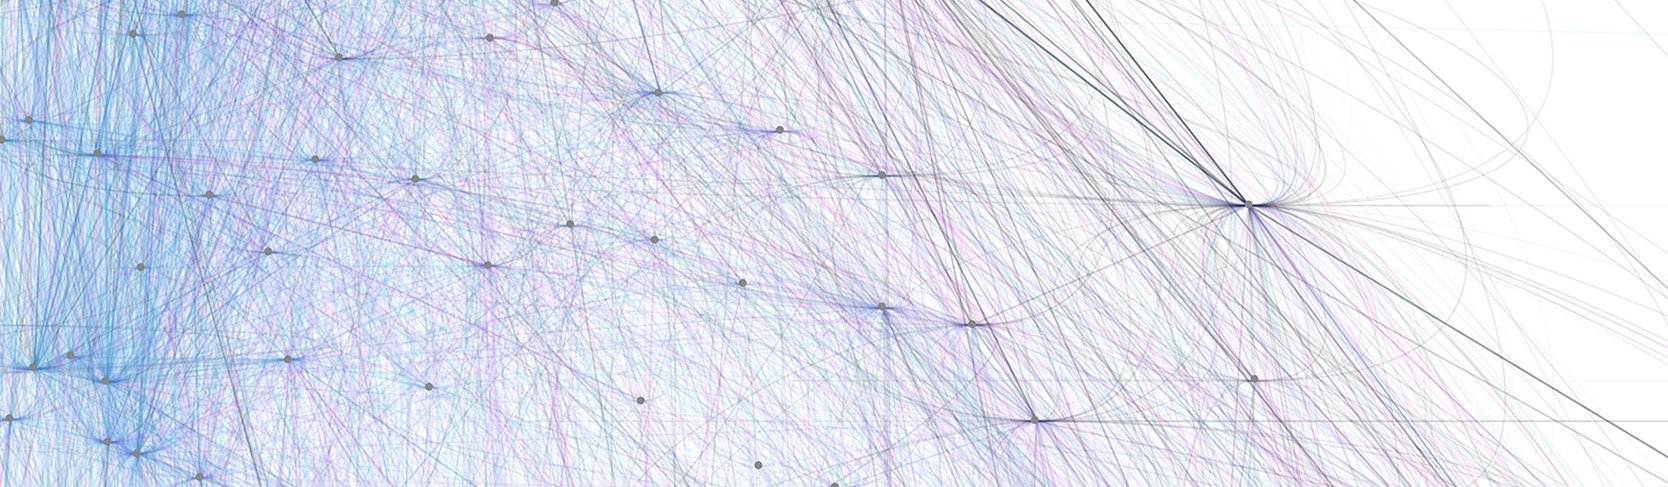
A visual created using Divvy trip information and stations
I've always harbored a deep fascination for the technical intricacies of web design. This curiosity has led me to dive into coding during my free hours, enriching my skill set and igniting my creativity in crafting digital solutions. From small experiments to ambitious projects, I've embraced the opportunity to apply my coding knowledge across various endeavors. This journey has allowed me to explore novel techniques, refine my abilities, and expand my web design horizons. If you're interested, I'd be thrilled to share more about my projects and welcome any feedback you may have.
Flocking Algorithm

Visuals generated by use of a Circle Packing algorithm
Visual generated by using Perin Noise and flow fields.
When you work on websites you’re exposed to the backbones of it; HTML, javascript and CSS. And as a visual creative I’ve always had an interest in data being visually represented. So utilizing a program called Processing and the freely available data of Divvy I created a visual representation of the rides taken on a random day. The dots represent the Divvy Stations and the lines are the routes traveled. The colors represent if the person is male (blue), female (pink) or undefined (grey). While the visuals are almost purely data driven I did take some creative license and randomized the curvature of the lines to give it some additional visual interest.


Perlin Noise flow-field
Quad tree mapping